[LWJGL] [JOML] Memory Behavior

Hey guys,

I’m working on my engine… just simple things abour rendering and architecture.

I put everything in a really small scene to investigate possible memory leaks and minor issues related to the code.

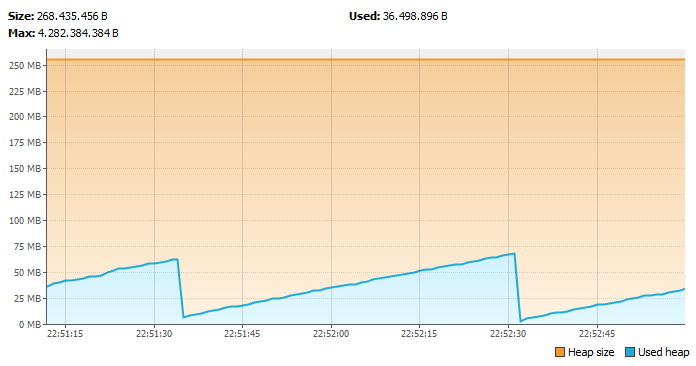
I have this strange behavior (at least I think that is) analyzing through VisualVM

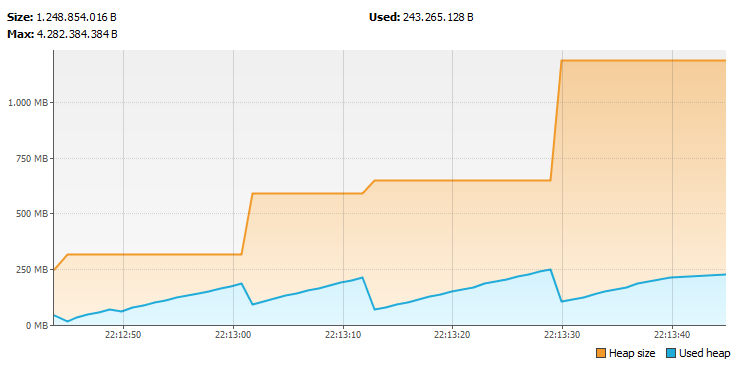
When I go to smapler to analyze my variables and how many objects are allocated it seems right except for this:

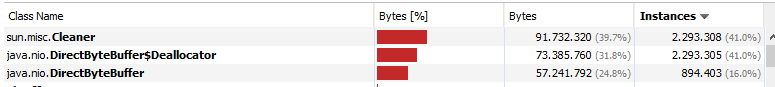
Anyone has a similar problem using JOML and LWJGL? Or possible/common problems to result this?

Thank you!!

This comes from you allocating a lot of native memory buffers using NIO, possibly using BufferUtils.create***Buffer() calls. All those objects are related to managing native memory, which lies outside the Java memory heap. You should:

  • try to reuse native memory buffers
  • manage native memory yourself instead to avoid GC overhead.

Thanks… I spend some minutes and update all shaders tu reuse the float buffers from Matrix4f instead allocate every time and now seems to be much better

=)

You can release the memory allocated on the native heap when you no longer need a direct NIO buffer by calling the cleaner yourself, I assume that it’s what theagentd meant in his second suggestion.

Nope, I’m not a big fan of the Cleaner “hack”. You’ll generally get much better performance by managing memory yourself with malloc/free. In LWJGL, that can be done with MemoryUtil.memAlloc() and MemoryUtil.memFree(), which under the hood uses the best library for the job (usually Jemalloc).

Ok but the principle is mostly the same, you manage the memory not on the Java heap by yourself as the garbage collector is of little help in this case. Sorry, “by calling the cleaner” wasn’t what you suggested.