GC causing massive delay

http://pastebin.com/eXWS0qrc

The output above is;

System.out.println(((Runtime.getRuntime().totalMemory() - Runtime.getRuntime().freeMemory()) / 1024));

and as you can see GC occurs at 1526 and right at that moment my frames drop from solid 60 to 35

I’m using -XX:+UseConcMarkSweepGC as my GC, I tried other types as well but none of them really helped me

Can anyone help me with this?

Concurrent garbage collection seems to be the way to go. At least it works well for me. You can try tweaking the memory settings a bit, but that’s likely not going to solve your overall problem.

Basically what happens is the GC thread causes everything else to pause while it goes through and cleans house. Adding a large chunk of memory just makes its pauses further apart, but last longer.

The real way to fix this is by profiling for your data build up. I use Java VisualVM to help profile and track down bottle necks.
http://docs.oracle.com/javase/6/docs/technotes/guides/visualvm/

What’s likely occurring is you’re creating a lot of new classes during your looping. One of the best ways to handle this is to reuse objects which can be reused. However, I recommend running your code through the Profiler first so you can get a break down of which classes are building up the most data.

Stop calling new inside of loops.

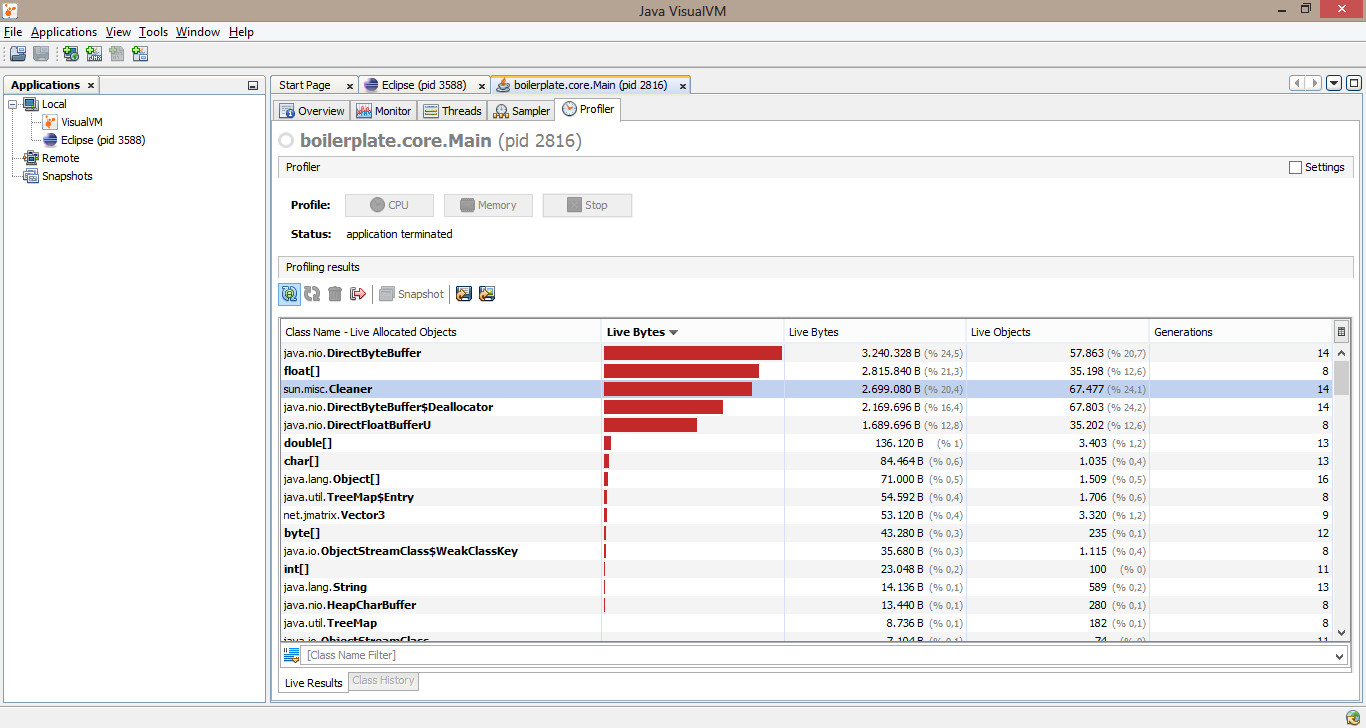
Does this basically mean that I have too much buffer objects and float arrays? Also what’s up with cleaner?

If you aren’t already, you could try using mapped buffers.

I have no idea about the ByteBuffers, the only case I’m using them is for loading textures (LWJGL)

I use this method:

The VBO must be bound before calling this method.


public static FloatBuffer mapBuffer(int length)
{
	GL15.glBufferData(GL15.GL_ARRAY_BUFFER, length << 2, GL15.GL_STATIC_DRAW);
	ByteBuffer buf = GL15.glMapBuffer(GL15.GL_ARRAY_BUFFER, GL15.GL_WRITE_ONLY, length << 2, null);
	return buf.order(ByteOrder.nativeOrder()).asFloatBuffer();
}

Returns a mapped float buffer.

Here’s my VertexBuffer object, I never change the contents of them (and I only have one atm) so I really doubt they are the stupid amount of float[] and FloatBuffers

http://pastebin.com/6faTZ21N

My guess is that the float[] and FloatBuffers are from my matrix/vector classes

Here’s Main.java

http://pastebin.com/CjnMAQFF

and Renderer.java

http://pastebin.com/8Lwg9ftw

In your renderer, in asFlippedFloatBuffer, cache a ByteBuffer and only use ONE (make it static and what not).

You call that ALOT and each time it creates a DirectByteBuffer… which allocates a chunk of memory outside the JVM… and when the JVM sees that it’s not in use it cleans it and removes it. This could take time and they could add up.

You’re not alone in this problem. I’m fairly certain you’re running up against the exact problem I encountered, because I built my own objects for handling matrices and vectors.

Also like you, I figured arrays would be the most natural way of handling this. Now you can still do it with arrays if you really want, but here’s what I found:
Arrays are objects, so every time you create one of those, you end up with the potential for garbage. This problem is compounded when you do things like set the Matrix by using a new float[] or have it return a new float[].

You may be wondering how you handle passing around matrices and stuff without referencing the original matrix. I mean if you pass a matrix to a method and have it mangle the bastard, it’s going to destroy the original copy you wanted to keep, since Java behaves like objects are pass by reference (pedantic note: My understanding is Java is considered pass by value).

The answer comes from a seemingly unlikely place. Since Java handles objects like references and primitives as values, it’s actually easier to to set your Matrices and Vectors to contain primitives. For me it felt like this goes against what you’re taught in programming 101. But like everything with code, it’s always subjective to the what you need it for.

So here’s what I did:
I changed my matrices to be something like


	public float c00 =1;	public float c10 =0;	public float c20 =0;	public float c30 =0;
	public float c01 =0;	public float c11 =1;	public float c21 =0;	public float c31 =0;
	public float c02 =0;	public float c12 =0;	public float c22 =1;	public float c32 =0;
	public float c03 =0;	public float c13 =0;	public float c23 =0;	public float c33 =1;

And of course the same thing as with the vectors.
Now you can do all the multiplication and what not by passing matrices into other matrices and then do your operation using the primitives.
Here’s an example of setting a matrix from another matrix


	public void setMatrix(Matrix4 matrix){ //Set the matrix
		
		this.c00 = matrix.c00;	this.c10 = matrix.c10;	this.c20 = matrix.c20;	this.c30 = matrix.c30;	
		this.c01 = matrix.c01;	this.c11 = matrix.c11;	this.c21 = matrix.c21;	this.c31 = matrix.c31;
		this.c02 = matrix.c02;	this.c12 = matrix.c12;	this.c22 = matrix.c22;	this.c32 = matrix.c32;
		this.c03 = matrix.c03;	this.c13 = matrix.c13;	this.c23 = matrix.c23;	this.c33 = matrix.c33;
	}

This way you avoid linking two matrices together by reference. The above method will create an entirely new set of values from the matrix which was passed in.

This actually turns out to be quite fast. I was a little concerned that using primitives like this would eventually lead slowing things down. So I did some testing and it turns out Java is very fast at setting primitive values. And since you’ll only handle up to 16 values, you’re not losing out by skipping arrays.
It also makes accessing individual cells kind of nice.

Conclusion:
I started down the rabbit hole of correcting my math, because I encountered the stuttering effect due to garbage collection. Before I fixed everything, I noticed my used memory was accumulating faster than an ex-wife could amass debt with her ex-husbands credit card. It was knocking over hundreds in seconds.
Now that I’ve cleaned the math up and reused objects like matrices, it takes a couple seconds before I even see it kick over 1 MB. I imagine you’ll encounter the same.

And like the others have said before me, reusing your Buffers will also go a long way.

In the end, I think most of us go through this at one point or another. So don’t let it get you down.

Could you give me an example on that as my buffers are varying in sizes? I was thinking of using a HashMap to store buffers in (if a key doesn’t have a value, generate it - if a key has a value, clear and re-insert values)

Remove your three methods toFloatArray, asFlippedFloatBuffer, and asFlippedByteBuffer and replace with this:


        ByteBuffer cachedBuffer = BufferUtils.createByteBuffer(4096);

        private static FloatBuffer asFlippedFloatBuffer(Matrix4 matrix4) {
                final ByteBuffer bb = cachedBuffer;
                bb.clear();
                for (int i = 0; i < 16; i++) {
                        bb.putFloat( (float)matrix4.mat[i] );
                }
                bb.flip();
                return bb.asFloatBuffer();
        }
 
        private static ByteBuffer asFlippedByteBuffer(byte[] arr) {
                final ByteBuffer bb = (arr.length > cachedBuffer.capacity() ? BufferUtils.createByteBuffer(arr.length) : cachedBuffer);
                bb.clear();
                bb.put(arr);
                bb.flip(); 
                return bb;
        }

I guessed 4096 was a large enough ByteBuffer… if you are sending more than matrices (like vertex data for example) up it to 65536 or something (64kb isn’t really that much).

Daaaaaamn… that is so amazing! Thanks a lot!

I don’t do the fast graphics like you do; I tend more towards the turn-based, and my problems tend to be more about checking who’s near whom and what’s the shortest path to somewhere. (And I write business software too.) And the GC problem usually shows ups as an out-of-memory exception (despite lots of free memory) rather than a slowdown. But your problems and mine are likely related, so:

The key word is Fragmentation. It’s been a long time since I’ve had a program hesitate while the GC runs. The GC that comes from Oracle with the JVM does a superb and invisible job. I don’t think even you should notice that it’s running, no matter how many new objects you create. But if you create large objects (arrays), then the GC has to look harder to find the contiguous space for them. When you’ve created–and freed–a bunch, your free memory is mostly large-object-sized chunks with, perhaps, pieces taken out for small new allocations. Now if you try to allocate a new large object, there’s no space quite big enough or contiguous enough. Your memory is fragmented.

The GC will work frantically to move allocated memory around to turn smaller free chunks into bigger chunks. If your program used memory at a leisurely pace (if your game ran 10 times slower), you’d never notice a problem. As it is, you are most likely seeing the resultant slowdown.

If you ignored it and let it get worse, eventually the GC would prefer throwing an exception to embarrassing itself with such abysmal performance. (That’s what usually happens to me.)

My solution is to avoid arrays and things that use them like HashMaps and ArrayLists and use TreeMaps and LinkedLists instead. This would, most often, not work for you; arrays really are much faster than, say LinkedLists, even for sequential reading. So my answer to your problem is, like most of the other ones: keep your arrays as small as you can and reuse them. The new arrays are the problem. (I’m putting this answer here to explain why this is happening; the solution’s been given several times over.)

(Also, making all your arrays the same size might help. The classic way to get this problem is to add millions of items to an ArrayList. Each time the ArrayList resizes, it needs a bigger array. Once the original memory is used up, free memory is fragmented into many large blocks, but none of them big enough for the next allocation.)

Thanks for the info, one problem I noticed is that I now have an increased amount of int[] which weren’t there before

EDIT: I accidentally ran sampling instead of profiling, it’s okay now

If the bulk of the memory usage is from DirectByteBuffers, then heap fragmentation isn’t so much the issue, or rather not the java heap anyway. Every direct buffer you allocate has to be malloc()'d individually from the native heap, and creates a PhantomReference and a Cleaner object that will free() it when it goes out of scope. Each one, individually. In short, while using direct buffers is ridiculously fast, allocating them is a very heavyweight operation. You’re meant to reuse them as much as possible.

ArrayList won’t reallocate every time you resize it, and will pre-extend itself by quite a bit. However, it actually tends to err on the side of pre-extending by too much which puts additional pressure on the GC for space you don’t need or use. If you have a good estimate on the number of items you’re putting into a collection, it’s always a good idea to instantiate it with the size hint and not the default of 10.

and use trimToSize to free up memory, if you’re not too sure what data size you’re dealing with upfront, and are running low on free memory. ArrayList at most allocates 50% too much memory (doubling the backing array every time) which is normally not enough to worry about. (C devs, will scream at me, I’ll look the other way :))

The problem I was referring to–whether or not the OP’s problem is another matter–is the too-rapid allocation and deallocation of large blocks of memory; it’s got little to do with using a lot of memory or wasting memory. The most typical symptom is getting an out-of-memory exception with 90% of memory free. The simplest way to do it is with something like:


    ArrayList  array = new ArrayList();
    while (true)  { array.add( something ); }

If the optimizers don’t interfere, this will, of course, throw an out-of-memory exception. What is unusual is that when it does a lot of memory will still be free. (There must be a dozen questions about this on StackOverflow.) The reason for the OOME is not that there’s no memory left, but that the GC is taking too long to merge free blocks and gives up rather than slow down too much.

Most people see the OOME and wonder why. I think game writers are more apt to see the slowdown and wonder why.

Reducing the size of allocated memory helps a lot. Reusing big arrays helps a lot. Doing lots of other work between allocations (giving the GC thread time to do it’s job) helps, too.

@relphchapin

I was surprised by your findings and was absolutely sure you were absolutely wrong :slight_smile:

The GC strategies (since about 15 years) don’t even merge free memory blocks. Garbage collectors don’t collect garbage, so to speak, they copy live objects into a new memory block, completely ignoring free space. When everything is copied, the whole original space is declared free for future use. That means that fragmentation is simply not an issue with Java objects and arrays - only for direct buffers, as they are backed by malloc/free algorithms.

Equally, the GC doesn’t throw its hands into the air and call it quits when it has to work really hard. There is one case, however, and that is that when the GC concludes that it is collecting garbage over 99% of the time, for an extended period (say, minutes), it will conclude it’s infeasible to continue running. This doesn’t happen in practice, unless you’re paging massive amounts of memory to disk and back, at which point your game/service is dead in the waters anyway.

On to your examples:


@@List<?> list = new ArrayList<>();
for (int i = 0; true; i++) {
	if (i % (1024 * 1024) == 0)
		System.out.println("i=" + (i / 1024 / 1024));
		list.add(null);
	}
}

Output: reaches ~150M elements on a 2GB heap in 5sec

@@List<?> list = new LinkedList<>();
for (int i = 0; true; i++) {
	if (i % (1024 * 1024) == 0)
		System.out.println("i=" + (i / 1024 / 1024));
		list.add(null);
	}
}

Output: reaches ~67M elements on a 2GB heap in 61sec

So your workaround results into slower code that fails earlier. It shouldn’t be advised.

System.out.println(System.getProperty("java.version"));
System.out.println(System.getProperty("java.vm.version"));
1.7.0_25
23.25-b01

The GC will give up if it’s unable to free space for allocation while meeting its pause time and throughput goals. As usual, the Java GC Tuning doc is a handy reference for the various knobs that control GC throughput among other things. It’s of little help when it comes to direct buffers though, since those are allocated much more primitively and slowly on a different heap.