TL;DR: This is a ramble about how a GPU works and why GPU performance is so hard to predict for different GPUs and OpenGL settings. It’s not meant to be read by people who aren’t interested in 3D or how GPUs work on a lower level than OpenGL.
It’s worth noting that vertex performance does not scale linearly with GPU power. A better GPU is of course faster, but not linearly. Pixel filling performance scales a bit better, but what scales the best is probably shader complexity. (Note: That came from my own personal experience, so it might not be accurate across the board.) Most games don’t want to be able to draw 10 million triangles per frame or have 50x overdraw over the whole screen. They want expensive render targets (usually 3 or 4 x 16-bit float RGBA), complex lighting calculations, more texture bandwidth and the likes, while MINIMIZING overdraw. BF3 even uses computing to do the lighting, which has proved to be a lot more effective than rendering lighting geometry with OpenGL for deferred shading. GPUs are obviously made for the games that use them, so a pathological case with lots of blending, lots of vertices or lots of cheap pixels, etc is not going to perform as well as a more realistic case for the GPU. We pretty much encounter a somewhat similar problem to microbenchmarking but for GPUs. We might also bottleneck one part which can leave other operations free since the hardware is a lot more specialized.
The GPU also does lots of optimizations based on what you enable. Enabling the depth test actually increases performance for 3D games (may be as high as 2-3x) depending on how many pixels that get rejected by the depth test since it can do the depth test before the color of the pixel is calculated. Face culling can also improve performance a lot. However, some of these optimizations might be unusable with some combinations of settings. For example, for blending to be accurate the polygons need to be processed in the order they are submitted, while without blending we’re only interested in the closest pixel, so the GPU can in theory process them in any order it want to (this is a speculation). Other things like enabling alpha testing or modifying the depth of a pixel with a shader also forces the the shader/fixed functionality to be run before the depth/alpha test. It’s easy to accidentally produce a case where the GPU cannot use such optimization. Even worse, the flexibility of the GPU varies between GPU generations and even more between vendors, so what works for you might crawl on another GPU, or vice versa.
I don’t even know a fraction of what my GPU does, but at least I know that I don’t know much about it and I take that into account. Ensuring that a you make it as easy as possible for the GPU to use its optimizations is important for real-world performance. Ever heard of a z pre-pass? It’s when you draw everything in the game twice to increase performance. Makes sense, doesn’t it? By first drawing only the depth of the scene to the depth buffer, we can then enable the depth test to only run the shader on the pixels that are actually visible. We might double the vertex cost of the game to reduce the amount of SHADED overdraw to 0, which might be a perfectly valid tradeoff if your pixel shaders are expensive enough.
GPUs are massive parallel processors. A GT430 “only” has:
-
96 unified shader processors. They can switch between processing vertices and pixels to adapt to some extent for an ineven workload. This was also introduced when deferred shading became big, when doing deferred shading you first have a very vertex-heavy workload, but then switch to lighting processing which is 100% pixel limited instead. Ancient cards with separate vertex shaders and pixel shaders would have half their shaders stalled when doing deferred shading.
-
16 texture mapping units. Not sure about all the things that they do, but they do handle bilinear filtering and spatial caching of texture samples. Bilinear filtering is free for 8-bit RGBA textures on today’s GPUs thanks to these. The texture cache also helps hugely when we are simply sampling a small local part of a texture. In this thread I made a program that benefited a lot from this cache. By zooming out too much, I could see what happens when we start to pretty much randomly sample the tile map, and FPS dropped from 1350 to 450 FPS. The shader workload remains identical, but we get a texture bottleneck! Wooh! That means we could do math in the shader for free as long as it isn’t dependent on the texture samples! Confused yet?
-
4 ROPs. You made me a bit curious, and it seems like “The ROPs perform the transactions between the relevant buffers in the local memory - this includes writing or reading values, as well as blending them together.” (Wikipedia). That would mean that the ROPs also handle the depth test and stencil test too in addition to blending. You learn something new everyday!
That’s usually written as 96:16:4. On the other hand, a Radeon HD 7970 has a core configuration of 2048:128:32. We have 21,3x the number of shaders, 8 times the number of texture mapping units and 8 times the number of ROPs. What’s up with the number of shaders?! Well, Radeon cards have traditionally had a higher number of shaders. NVidia countered this by having a separate shader clock which ran at double the clock of everything else on the card, meaning that the HD 7970 “only” has 10.6x the number of shaders in practice. (NVidia have with the recently released 700 series ditched the separate shader clock and tripled the number of shaders to match AMDs setup which is more power efficient.) On top of that, a ROP on one card may not equal a ROP on another card. For example, Nvidia’s ROPs are famous for being able to pump out more pixels per clock than AMD’s. Memory bandwidth also affects texture performance, ROP performance, how well the game scales with higher resolutions, etc. On top of THAT, we also have a GPU clock and a memory clock, which affect performance the same way they do for CPUs. Yes, it’s common to overclock your GPU if you have the cooling for it. NVidia’s newest cards released months ago even have built in overclocking when the card isn’t using as much power as it similar to how a quad-core CPU increases their clock-rate when not all cores are used. This was a great idea, since GPUs have so many hardware features that may not be used to their potential in a certain game. Here’s a diagram over a GTX 680, NVidias most powerful GPU at the moment:
http://www1.pcmag.com/media/images/285620-nvidia-geforce-gtx-680-block-diagram.jpg
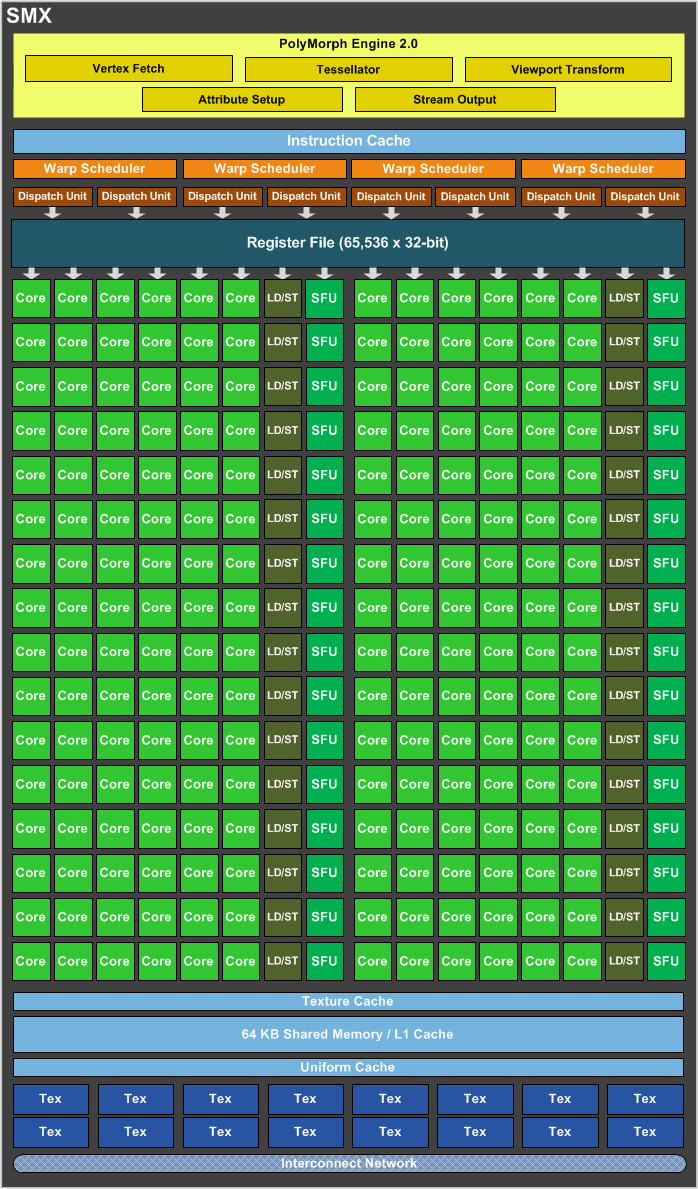
Only the small green boxes are unified shader units. What’re all those other things?! Here’s a zoomed in picture of one of an SMX:

Polymorph Engines (yellow): DX11 generation cards (your GT430 included) has hardware tesselators which can effectively cut up a triangle to generate smaller triangles, which can be displaced to create real uneven surfaces from a single triangle. NVidia does this with their Polymorph Engines, among other things as you can see (The 400 and 500 series use the first generation, the GTX 600 series the second, therefore 2.0). Does your game use tessellation? If no, we have idle hardware on your card. Doing too heavy tessellation of triangles can easily turn into a bottleneck too.
SFUs (dark green): These handle special floating point math (Special Floating point Unit), presumably things like trigonometric functions and maybe even square roots. They’re shared by a few shader units each, so they could be a bottleneck too.
Raster Engines (yellow): I believe these take in vertices and optionally indices, put together triangles and outputs which pixels are covered by the triangle (= rasterizing). Could these be the bottleneck when we have to much overdraw of cheap pixels?
Conclusion: I could go on and on, but I think you get it by now or rather, you get that you don’t get it. xD What’s bottlenecking your program? I don’t know. =D I wasn’t saying that the ROPs were bottlenecking your programming, I meant that it could be anything, and that you’re not utilizing your GPU in the way the makers of it expected.